
Analytics and reports
Analytics shows how the posts you published actually did — pulled back from each network, per channel and per post, with no tracking pixel or extra setup on your side.
The numbers#
For every post PostPost.ai collects what the network reports:
| Metric | What it counts |
|---|---|
| Impressions | Times the post was shown |
| Likes · Comments · Shares · Saves | The four engagement actions |
| Clicks | Link clicks, where the network reports them |
| Engagement rate | Likes + comments + shares + saves, over impressions |
Followers per channel are collected too, so you can see the account growing rather than only individual posts.
The dashboard#
- Period — 7, 30 or 90 days, or a custom range.
- Channel chips — narrow everything to one channel.
- The chart — impressions or engagement over time, as one total line, one line per channel, or one line per content type.
- Top performing posts — your best posts for the period, five up front and the rest revealed in place. The ranking includes posts that were published outside PostPost.ai too, so the picture is the channel’s, not just ours.
- Per-channel cards — the same metrics broken out per connected account.
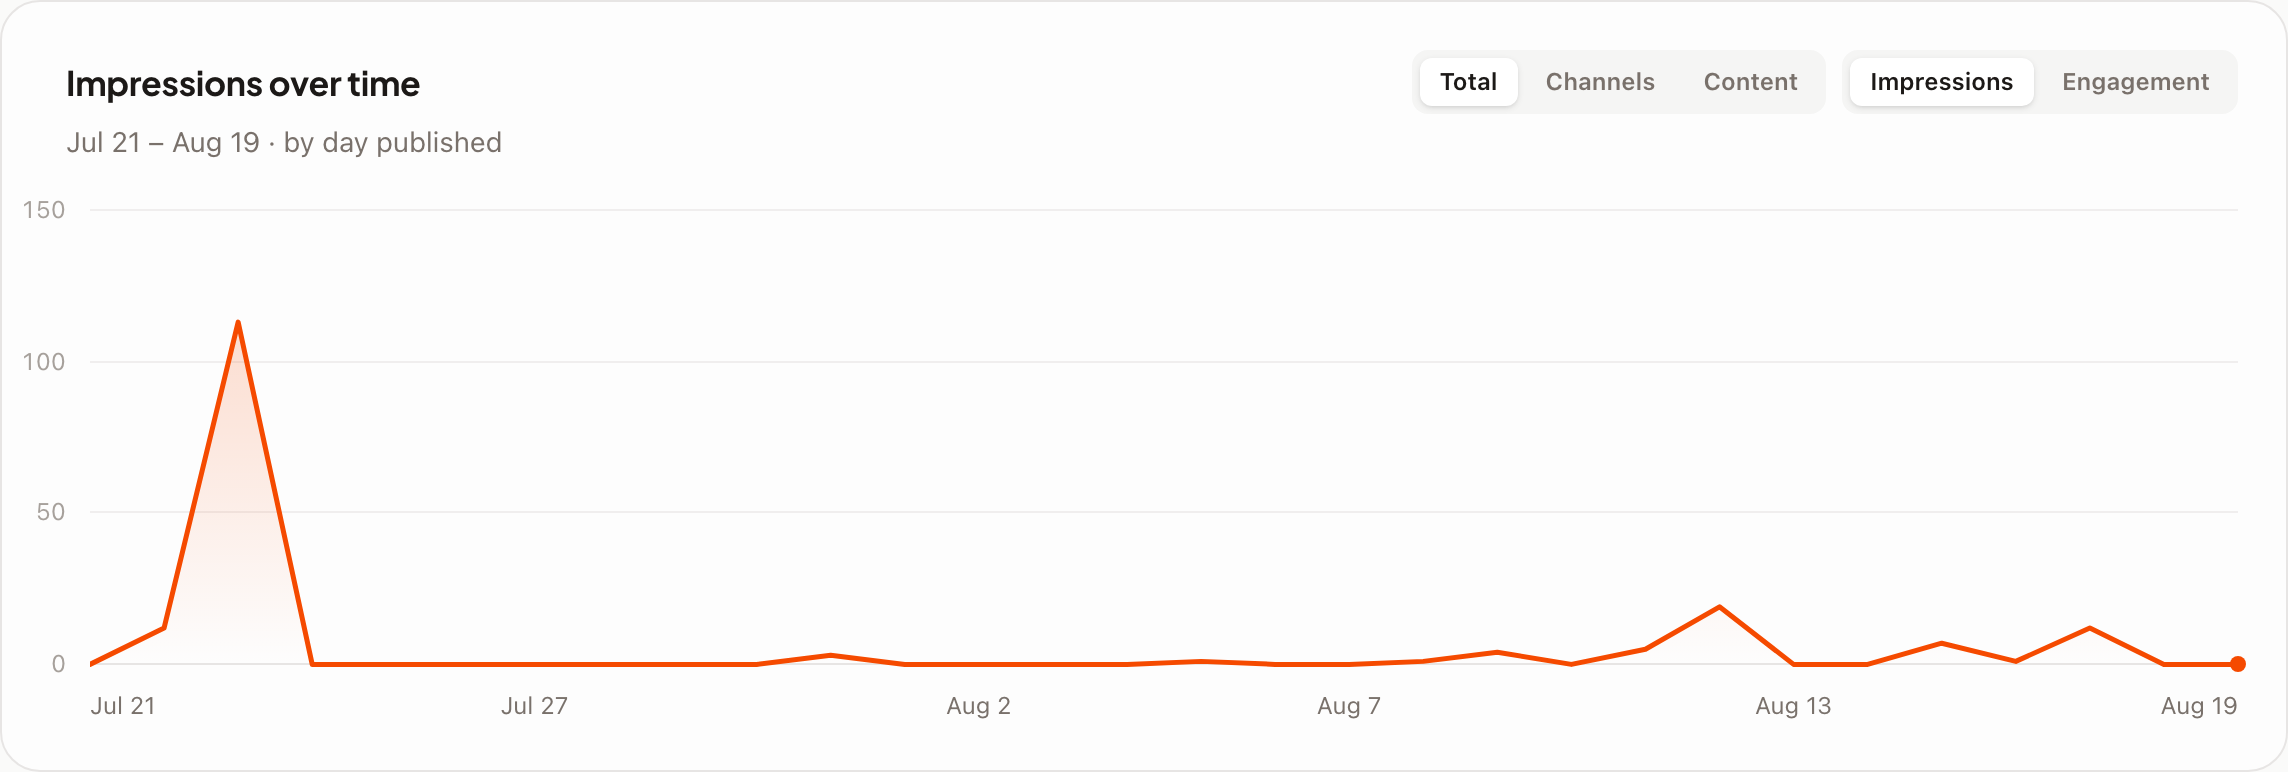
Numbers refresh hourly in the background. A post published minutes ago will show zeros for a while — that’s the network not having reported yet, not a missing post.
Exporting#
The posts table exports to CSV with every metric column, not only the rows on screen:
- Download selected period — the window and channel filter you’re looking at.
- Download all data — the last 12 months, keeping the channel filter.
Unlimited analytics and export come with Pro and above; see Plans and what’s included.
Where numbers can be missing#
Analytics is only ever as complete as what each network shares, and two gaps are worth knowing before you go looking for a bug:
- LinkedIn personal profiles report no post statistics. LinkedIn doesn’t expose them to any tool — Company Pages report normally.
- Some networks report less than others, and a few report nothing for certain surfaces. Where a number genuinely isn’t available, PostPost.ai shows it as unavailable rather than as a zero.
A post that failed to publish has nothing to measure — check its channel rows first, see When a post doesn’t publish.
Times and time zones#
Analytics is grouped in your brand’s time zone, the same one the posting queue uses — so a day in the chart is the audience’s day. See Scheduling, time zones, and cross-posting.